
Can a Streaming Database Power a Trading Desk UI? (Part 2)
Getting Real-Time Data to the UI

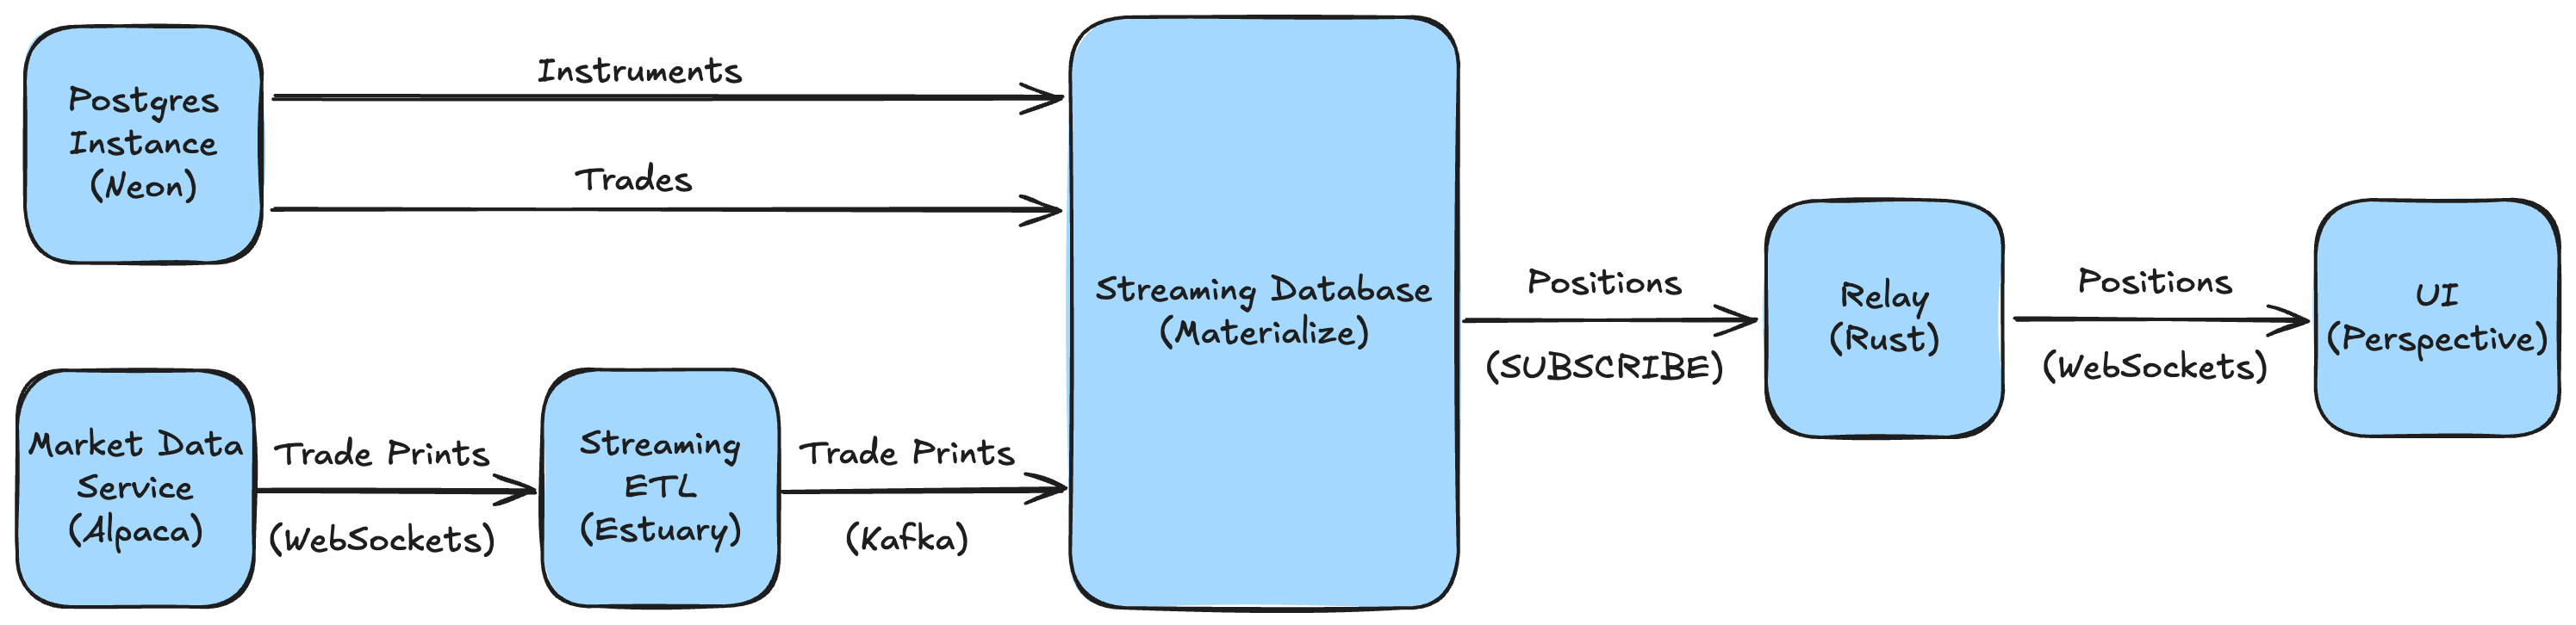
This post continues from Part One, where I built a real-time core for a positions UI using Materialize. Trades, instruments, and market data were flowing into a live view of quantity, market value, and theoretical P&L, with millisecond-level latency. The next step was getting that data into a UI in real time, with minimal code and infrastructure.
Exploring the Options
As in Part One, the goal was to build the UI with as little custom code as possible. I began by looking into whether anyone had done this before, and what tools they’d used to make it work.
I found surprisingly little. There was a Materialize plugin for Grafana, which wasn’t a good fit given Grafana’s focus on monitoring. Some people were piping views to database tables to feed Streamlit or Metabase dashboards, which wasn't truly real-time. But most commonly, people were building their own lightweight processes to stream data over WebSockets, like this blog post using Deno and Chart.js.
So I started looking more broadly. Were there other approaches that could work for my use case?
Low-Code Platforms and Admin Panel Builders
I started with low-code platforms like Retool. Retool excels at creating UIs and workflows on top of APIs and data sources, so in theory it felt like a good fit. But it doesn't support real-time subscriptions — only polling or manual refresh.
I also looked briefly at Refine. It’s a more developer-oriented React framework for building admin panels with strong Postgres support. While it does support real-time data, I would have needed to build a custom Materialize integration, so it wouldn’t have saved any coding.
There are many other similar low-code platforms and admin panel builders, but I couldn't find any with true, off-the-shelf real-time support.
REST and GraphQL
I also explored exposing Materialize over REST or GraphQL, both common APIs for front-end data access. REST was a non-starter — it isn’t built for real-time — but GraphQL supports subscriptions and is well supported by most frontend frameworks.
That led me to Hasura, a data access layer for Postgres. It exposes your database as a GraphQL API with minimal setup, featuring built-in filtering, joining, and access control. Since Materialize is Postgres-compatible it seemed like a perfect fit, but Hasura polls periodically rather than streaming changes in real time, which wouldn't give me the tick-by-tick updates I needed.
I also looked at Apollo, a more flexible way to build GraphQL APIs over any data source. It looked promising, but I’d still have needed to build an integration for Materialize. Since the main goal was to get streaming data into a UI with minimal effort, I didn’t want to add another platform and a bunch of glue code.
View Servers
Finally I explored view servers, which are common in many financial markets applications. These components typically stream data to frontends over WebSockets, with built-in rate limiting and access control. Genesis and Deephaven, for example, both feature UI servers as part of their larger platforms (e.g. Genesis’ Data Server), but these aren’t available as standalone components.
FinOS Vuu was promising as an open source project designed for fast-moving data and many connected users. While it seemed straightforward to integrate and get running, I would’ve also needed to adopt its built-in grid, whereas I was more looking to compose a solution from standalone components.
Implementation
Overview
Having found no plug-and-play options, it was time to build. I decided to follow the approach outlined in the Deno + Chart.js example: a backend process subscribing to Materialize, pushing updates over WebSockets to a grid. Another option was to use a Materialize sink, but that would’ve needed a Kafka cluster and made it harder to send data to the frontend.
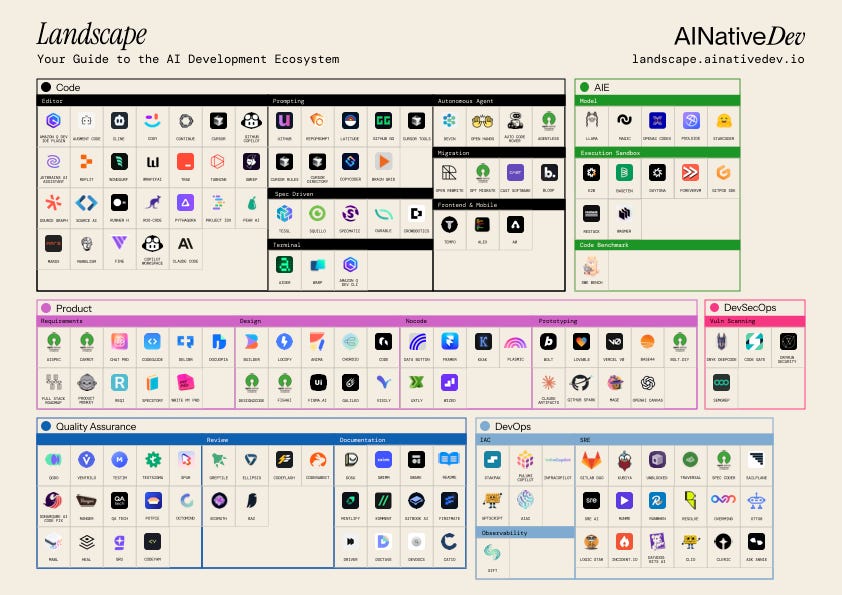
As I hadn’t coded in over a decade, I was going to need some help. I wanted to treat AI as if it were a developer colleague — I’d provide the spec, and it would generate and update the code as the spec evolved. This 'AI-native development' approach — championed by startups like Tessl — is gaining ground as a more deterministic alternative to vibe coding. I worked with Claude to write detailed specifications, and used Cursor to implement the code.
Backend
I chose Rust for the backend relay. It's fast, memory-safe, and widely used for low-level infrastructure — including Materialize itself. Deno was another solid option, but I’d already seen that path explored and wanted to try something different.
Next, I used Claude to create a detailed specification for Cursor to work from, covering the context, architecture, and requirements. Cursor implemented the code using tokio and, after a few issues with authentication and connection handling, got everything working. I’m no stranger to vibe coding, but watching Cursor write code and fix bugs on the fly still felt like magic.
Once up and running locally, I connected to the relay with wscat and saw real-time data flowing into the terminal. The data refreshed as the market moved and as new trades were inserted, meaning everything was in place for the UI.
You can find the backend code on GitHub: tycoworks/rust-relay.
Frontend
Since the UI was simple — just a grid connected to a WebSocket — I went with plain HTML and JavaScript. I used Vite to build and test the app locally, which automatically detected file changes and refreshed the browser as I worked.
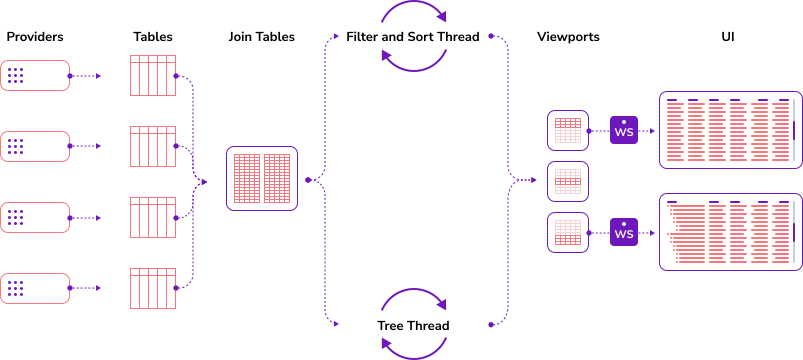
For the grid, I needed something that could handle large, streaming datasets. Two options stood out: AG Grid, a high-performance data grid which we used at Genesis; and Perspective, a grid and charting component compiled to WebAssembly. AG Grid would’ve been a perfect fit, but I went with Perspective to try something new, and because I was curious about its built-in analytics features.
As with the backend, I created a specification file describing the UI layout and requirements, but implementation was a little trickier. Cursor struggled with CDN imports, WebAssembly loading, and even tried to swap out Perspective for another grid component a couple of times. After nearly 30 iterations and some manual debugging in the browser, we finally got Perspective up and running — but the grid was empty.
After a bit of debugging, I realized the problem was with the relay. It was correctly forwarding updates from Materialize, but wasn’t sending the initial state of the data when the frontend connected. This turned out to be a gap in the spec, so I asked Cursor to add it and regenerate the code. After a couple of iterations on the snapshot logic, I had a live positions view ticking with the market.
Frontend code is available here: tycoworks/ui-grid.
Conclusion
So, can a streaming database power a real-time financial markets UI? I believe so. I built a real-time positions UI with Materialize at its core and, although updates ticked a little more slowly than I expected, I suspect that was due to things like using trades instead of BBO, the Estuary bridge, or running with stock Materialize config.
While getting data into Materialize was a little fiddly, getting data out was the bigger surprise. Most people seemed to be creating custom processes to stream data into the browser, with no clear off-the-shelf option. It feels like there should be a better way — especially if you also need entitlements, filtering, and scalability.
Is there a product here? A "Hasura for streaming databases", providing streaming data over GraphQL and WebSockets? Is there demand for streaming data into UIs, or is the bigger opportunity in powering AI agents? That's what I'll look at next.